
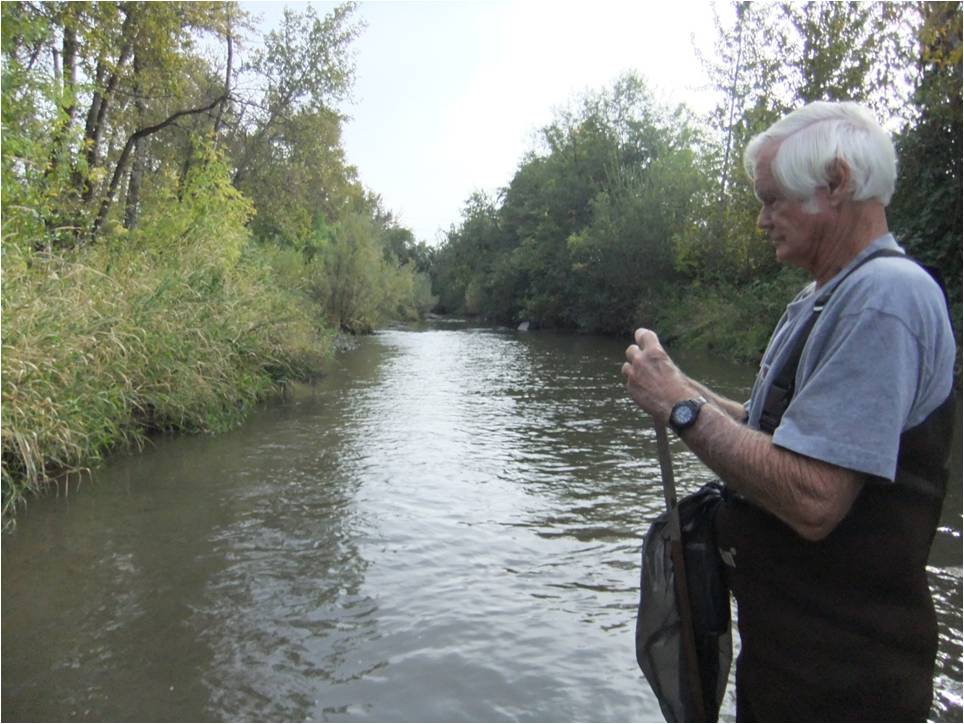
 Each October Jim Hutchins counts salmon in Bear Creek in downtown Medford, Oregon at three locations. Counting began October 1, 2011 and Jim saw 2 jack salmon. With rains forcast this next week, more fish should start moving upstream. The highest count is usually between October 15 to October 20. Below is a link to Jim counting fish in 2009.
Notes on fish surveys
Salmon are currently in Bear Creek; the best place to see them is near the McAndrews bridge at the Rogue Valley Mall. We’re hoping for rain; the creek is very low right now. No salmon have been counted in the Illinois River yet. (Oct. 15)
Salmon counts in Bear Creek and the Illinois River were strong in 2011. Bear Creek returns were above average, while the Illinois River counts were the third highest since I have been counting. Our highest year was 2003. Several above average size Chinook were viewed at both Bear Creek and the Illinois River, exceeding 30 pounds. Counts are done the month of October. There are done at three check points in each stream.
October, 2012 saw a steady increase in Chinook salmon counted on both Bear Creek and the Illinois River. Spawning occurred in wide spread sections of both streams, which can be an indicator of healthy, sustainable runs.
In 2014 and 2015 we saw the largest runs yet in Bear Creek in downtown Medford. The spawning activitiy was widespread from below the mall to downtown Ashland. The counts in the Illinois River were not extremely high, but it was a solid count, showing sustainability. Bear Creek in downtown Medford had the 4th highest salmon count since 1994 in 2017. Counts on the Illinois were about average. Counts in both 2016 and 2017 were above average. The number in 2020 almost doubled from the previous year. Spawning occurred from downtown Medford all the way to Ashalnd.
See chart below for yearly counts. Low water in both rivers caused salmon to spawn lower.
BEAR CREEK ILLINOIS RIVER
Year Total Year Total
1994 10 2003 400
1995 144 2004 373
1996 27 2005 136
1997 26 2006 135
1998 17 2007 77
1999 4 2008 63
2000 146 2009 136
2001 65 2010 156
2002 158 2011 254
2003 283 2012 334
2004 59 2013 431
2005 70 2014 161
2006 162 2015 190
2007 77 2016 104*
2008 17 2017 135
2009 78 2018 145
2010 101 *high water prevented count
2011 109
2012 115
2013 125
2014 404
2015 321
2016 187
2017 234
2018 231
2019 109
2020 197
2021 280
2022 120
2023 144